
In this episode we move on from creating the tables with constraints, foreign keys, proper indexes, enums, reversing each migrations, seeded data etc. Now let’s check our seeded data with some ui tool that help us smell and modify our db data.
Setup a UI tool for analysing SQL and data
W’re using PostgreSQL. Here are the best SQL GUI tools for pure SQL data analysis and manipulation on macOS:
🏆 Top Recommendations for SQL Analysis
1. TablePlus ⭐️ (Highly Recommended)
- Best for: Fast SQL queries, data filtering, before/after comparisons
- Strengths:
Lightning-fast query execution
Excellent data filtering UI with SQL query builder
Beautiful native macOS interface
Export to CSV/JSON/SQL
Query history and favorites
Cost: Free tier (2 tabs), Pro $89
Perfect for: Your use case of checking seeded data
2. Postico (macOS Native)
- Best for: PostgreSQL-specific features and analysis
- Strengths:
Built specifically for PostgreSQL
Excellent for large dataset analysis
Advanced filtering and sorting
Beautiful data visualization
Cost: $49 (one-time)
PostgreSQL-optimized: Uses all PostgreSQL features
3. pgAdmin (Free, Official)
- Best for: Advanced PostgreSQL administration and complex queries
- Strengths:
Official PostgreSQL tool
Advanced query planner visualization
Excellent for performance analysis
Complete database management
Cost: Free
Learning curve: Steeper but very powerful
4. DBeaver (Free, Cross-platform)
- Best for: Advanced SQL analysis and scripting
- Strengths:
Powerful SQL editor with autocomplete
Data export in multiple formats
Query execution plans
Visual query builder
Cost: Free (Community), Pro $10/month
Great for: Complex data analysis workflows
Quick Setup Commands
For TablePlus (easiest to get started):
# Install via Homebrew
brew install --cask tableplus
For pgAdmin:
# Install via Homebrew
brew install --cask pgadmin4
For Postico:
# Install via Homebrew
brew install --cask postico
🔧 Connection Details You’ll Need
Your PostgreSQL connection details:
- Host:
localhost(default) - Port:
5432(default) - Database:
academic_sql_software_development - Username: Your macOS username (default)
- Password: None (default for local development)
💡 Pro Tips for Data Analysis
Once connected, you can:
- Check seeded data:
   SELECT COUNT(*) FROM users;
   SELECT COUNT(*) FROM orders;
   SELECT COUNT(*) FROM products;
- Analyze relationships:
   SELECT
     u.first_name, u.last_name,
     COUNT(o.id) as order_count
   FROM users u
   LEFT JOIN orders o ON u.id = o.user_id
   GROUP BY u.id, u.first_name, u.last_name
   ORDER BY order_count DESC;
- Filter and export specific datasets for before/after comparisons
My Recommendation: Start with TablePlus – it’s the most intuitive for our workflow of checking and filtering seeded data, with excellent performance for the data volumes we’re working with (10k users, 5k orders, etc.).
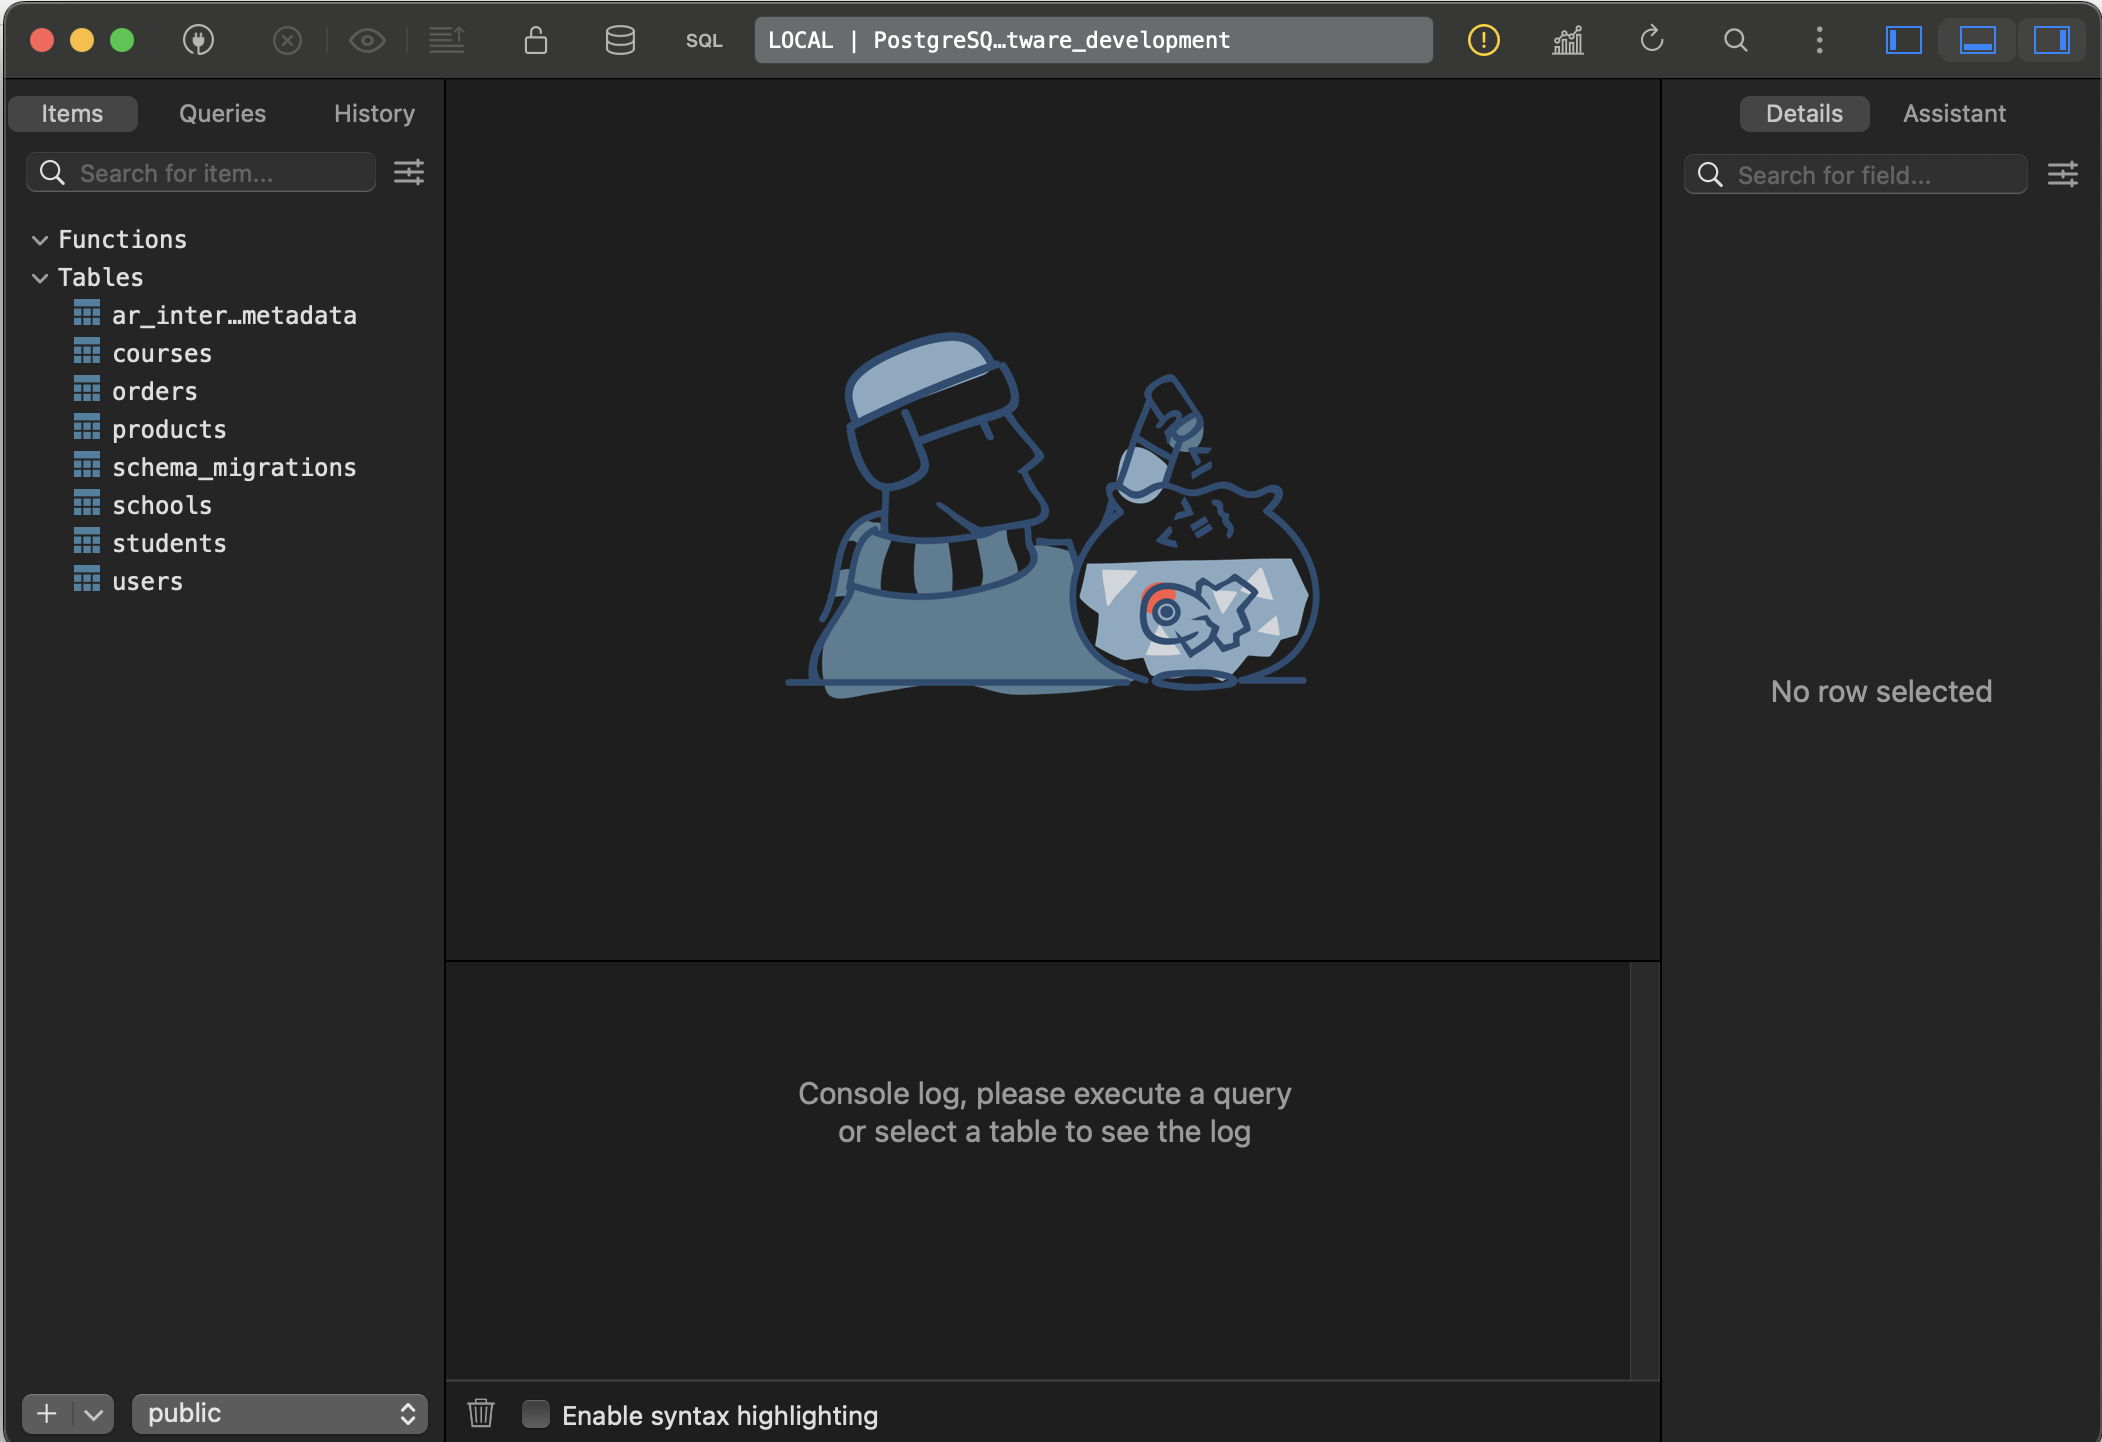
Let’s Go with TablePlus 🥳
🚀 Step 1: Install TablePlus
brew install --cask tableplus
📊 Step 2: Check Our Database Schema
We have a great setup for learning SQL with realistic relationships. Let’s create a progressive SQL learning path using our actual data.
🔗 Step 3: Connect to Your Database
TablePlus Connection Details:
- Host: localhost
- Port: 5432
- Database: academic_sql_software_development
- User: (your macOS username)
- Password: (leave blank)
📚 SQL Learning Path: Basic to Advanced
Change Font size, colour, theme etc:
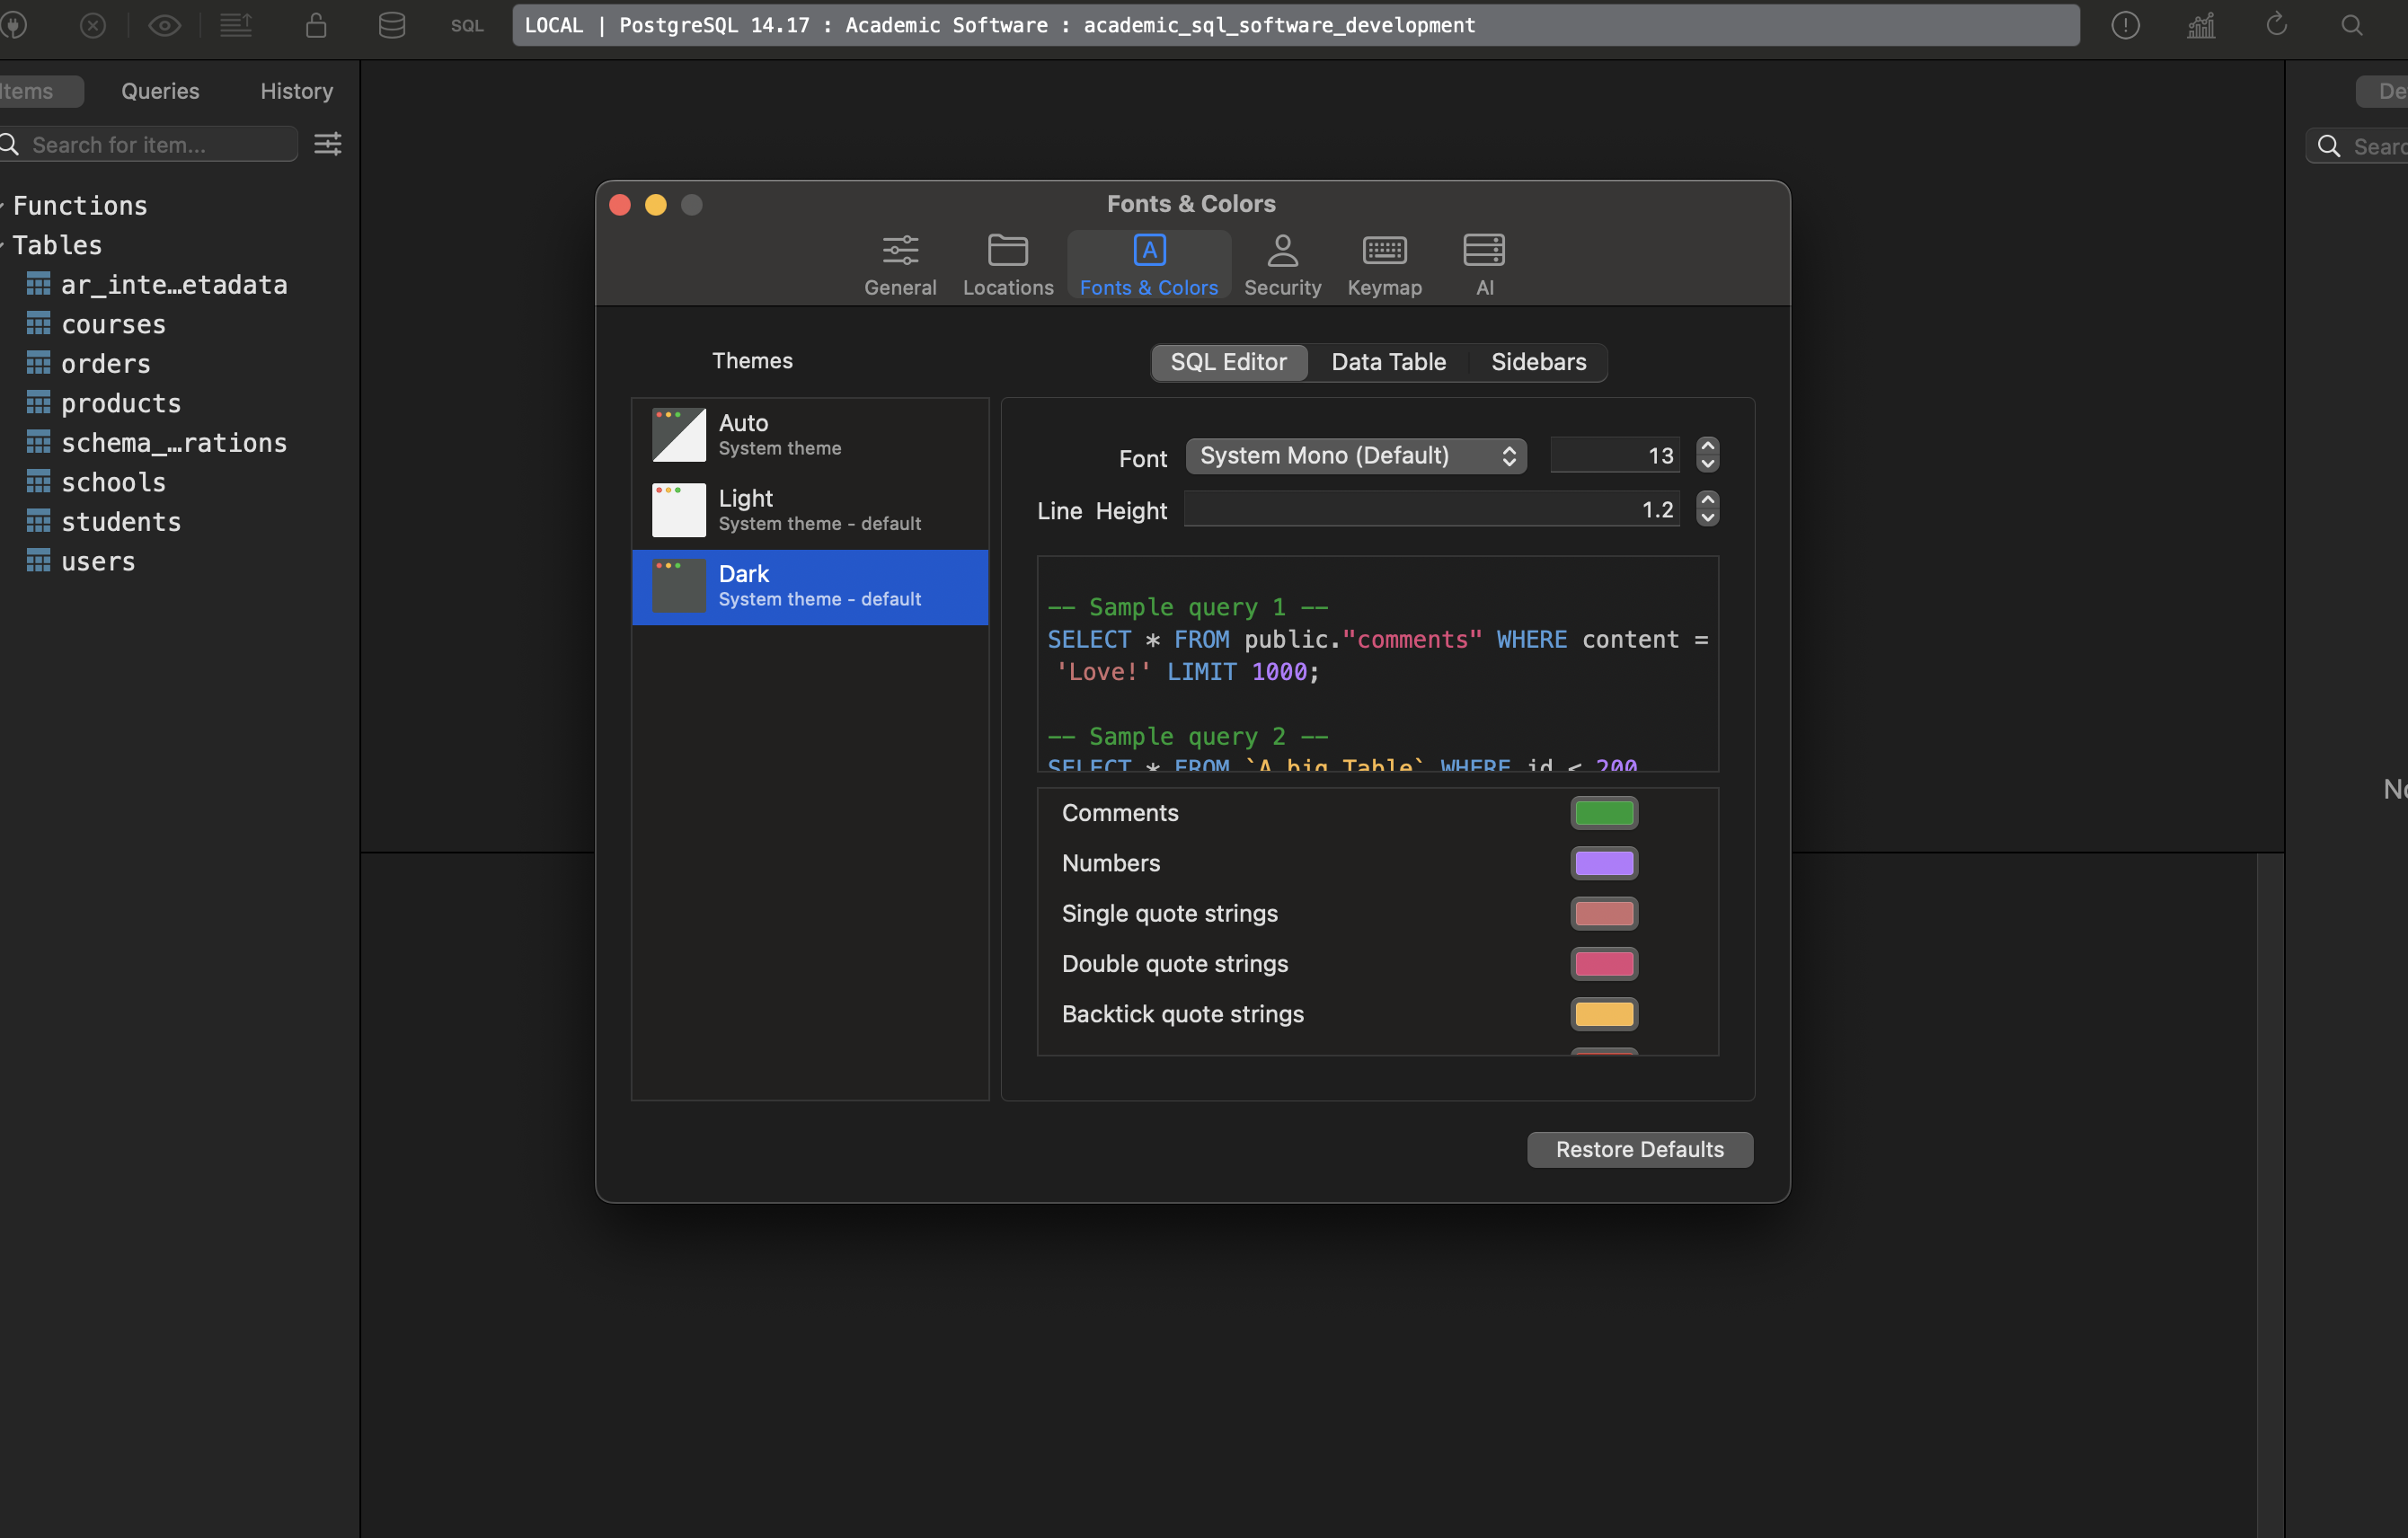
Level 1: Basic SELECT Queries
-- 1. View all users
SELECT * FROM users LIMIT 10;

-- 2. Count total records
SELECT COUNT(*) FROM users;
SELECT COUNT(*) FROM orders;
SELECT COUNT(*) FROM products;

-- 3. Filter data
SELECT first_name, last_name, email
FROM users
WHERE gender = 'female'
LIMIT 10;

-- 4. Sort data
SELECT first_name, last_name, date_of_birth
FROM users
ORDER BY date_of_birth DESC
LIMIT 10;

-- 5. Filter with conditions
SELECT title, price, category
FROM products
WHERE price > 50 AND category = 'men'
ORDER BY price DESC;
Level 2: Basic Aggregations
-- 1. Count by category
SELECT category, COUNT(*) as product_count
FROM products
GROUP BY category;

-- 2. Average prices by category
SELECT category,
       AVG(price) as avg_price,
       MIN(price) as min_price,
       MAX(price) as max_price
FROM products
GROUP BY category;

-- 3. Users by gender
SELECT gender, COUNT(*) as user_count
FROM users
WHERE gender IS NOT NULL
GROUP BY gender;

-- 4. Products with low stock
SELECT COUNT(*) as low_stock_products
FROM products
WHERE stock_quantity < 10;
Level 3: Inner Joins
-- 1. Users with their orders
SELECT u.first_name, u.last_name, u.email, o.id as order_id, o.created_at
FROM users u
INNER JOIN orders o ON u.id = o.user_id
ORDER BY o.created_at DESC
LIMIT 20;

-- 2. Orders with product details
SELECT o.id as order_id,
       p.title as product_name,
       p.price,
       p.category,
       o.created_at
FROM orders o
INNER JOIN products p ON o.product_id = p.id
ORDER BY o.created_at DESC
LIMIT 20;

-- 3. Complete order information (3-table join)
SELECT u.first_name, u.last_name,
       p.title as product_name,
       p.price,
       p.category,
       o.created_at as order_date
FROM orders o
INNER JOIN users u ON o.user_id = u.id
INNER JOIN products p ON o.product_id = p.id
ORDER BY o.created_at DESC
LIMIT 20;
Level 4: Left Joins (Show Missing Data)
-- 1. All users and their order count (including users with no orders)
SELECT u.first_name, u.last_name, u.email,
       COUNT(o.id) as order_count
FROM users u
LEFT JOIN orders o ON u.id = o.user_id
GROUP BY u.id, u.first_name, u.last_name, u.email
ORDER BY order_count DESC;

-- 2. Users who haven't placed any orders
SELECT u.first_name, u.last_name, u.email, u.created_at
FROM users u
LEFT JOIN orders o ON u.id = o.user_id
WHERE o.id IS NULL
ORDER BY u.created_at DESC;

-- 3. Products that have never been ordered
SELECT p.title, p.price, p.category, p.stock_quantity
FROM products p
LEFT JOIN orders o ON p.id = o.product_id
WHERE o.id IS NULL
ORDER BY p.price DESC;
Level 5: Advanced Aggregations & Grouping
-- 1. Top customers by order count
SELECT u.first_name, u.last_name,
       COUNT(o.id) as total_orders,
       SUM(p.price) as total_spent
FROM users u
INNER JOIN orders o ON u.id = o.user_id
INNER JOIN products p ON o.product_id = p.id
GROUP BY u.id, u.first_name, u.last_name
HAVING COUNT(o.id) > 1
ORDER BY total_spent DESC
LIMIT 10;

-- 2. Most popular products
SELECT p.title, p.category, p.price,
       COUNT(o.id) as times_ordered,
       SUM(p.price) as total_revenue
FROM products p
INNER JOIN orders o ON p.id = o.product_id
GROUP BY p.id, p.title, p.category, p.price
ORDER BY times_ordered DESC
LIMIT 10;

-- 3. Monthly order analysis
SELECT DATE_TRUNC('month', o.created_at) as month,
       COUNT(o.id) as order_count,
       COUNT(DISTINCT o.user_id) as unique_customers,
       SUM(p.price) as total_revenue
FROM orders o
INNER JOIN products p ON o.product_id = p.id
GROUP BY DATE_TRUNC('month', o.created_at)
ORDER BY month;
Level 6: Student Enrollment Analysis (Complex Joins)
-- 1. Students with their course and school info
SELECT u.first_name, u.last_name,
       c.title as course_name,
       s.title as school_name,
       st.enrolment_date
FROM students st
INNER JOIN users u ON st.user_id = u.id
INNER JOIN courses c ON st.course_id = c.id
INNER JOIN schools s ON st.school_id = s.id
ORDER BY st.enrolment_date DESC
LIMIT 20;

-- 2. Course popularity by school
SELECT s.title as school_name,
       c.title as course_name,
       COUNT(st.id) as student_count
FROM students st
INNER JOIN courses c ON st.course_id = c.id
INNER JOIN schools s ON st.school_id = s.id
GROUP BY s.id, s.title, c.id, c.title
ORDER BY student_count DESC;

-- 3. Schools with enrollment stats
SELECT s.title as school_name,
       COUNT(st.id) as total_students,
       COUNT(DISTINCT st.course_id) as courses_offered,
       MIN(st.enrolment_date) as first_enrollment,
       MAX(st.enrolment_date) as latest_enrollment
FROM schools s
LEFT JOIN students st ON s.id = st.school_id
GROUP BY s.id, s.title
ORDER BY total_students DESC;
Level 7: Advanced Concepts
-- 1. Subqueries: Users who spent more than average
WITH user_spending AS (
  SELECT u.id, u.first_name, u.last_name,
         SUM(p.price) as total_spent
  FROM users u
  INNER JOIN orders o ON u.id = o.user_id
  INNER JOIN products p ON o.product_id = p.id
  GROUP BY u.id, u.first_name, u.last_name
)
SELECT first_name, last_name, total_spent
FROM user_spending
WHERE total_spent > (SELECT AVG(total_spent) FROM user_spending)
ORDER BY total_spent DESC;

-- 2. Window functions: Ranking customers
SELECT u.first_name, u.last_name,
       COUNT(o.id) as order_count,
       SUM(p.price) as total_spent,
       RANK() OVER (ORDER BY SUM(p.price) DESC) as spending_rank
FROM users u
INNER JOIN orders o ON u.id = o.user_id
INNER JOIN products p ON o.product_id = p.id
GROUP BY u.id, u.first_name, u.last_name
ORDER BY spending_rank
LIMIT 20;

-- 3. Case statements for categorization
SELECT u.first_name, u.last_name,
       COUNT(o.id) as order_count,
       CASE
         WHEN COUNT(o.id) >= 5 THEN 'VIP Customer'
         WHEN COUNT(o.id) >= 2 THEN 'Regular Customer'
         ELSE 'New Customer'
       END as customer_type
FROM users u
LEFT JOIN orders o ON u.id = o.user_id
GROUP BY u.id, u.first_name, u.last_name
ORDER BY order_count DESC;
Level 8: Self-Joins & Advanced Analysis
-- 1. Find users enrolled in the same course (pseudo self-join)
SELECT DISTINCT
       u1.first_name || ' ' || u1.last_name as student1,
       u2.first_name || ' ' || u2.last_name as student2,
       c.title as course_name
FROM students s1
INNER JOIN students s2 ON s1.course_id = s2.course_id AND s1.user_id < s2.user_id
INNER JOIN users u1 ON s1.user_id = u1.id
INNER JOIN users u2 ON s2.user_id = u2.id
INNER JOIN courses c ON s1.course_id = c.id
ORDER BY c.title, student1
LIMIT 20;

-- 2. Complex business question: Multi-role users
SELECT u.first_name, u.last_name, u.email,
       COUNT(DISTINCT o.id) as orders_placed,
       COUNT(DISTINCT st.id) as courses_enrolled,
       CASE
         WHEN COUNT(DISTINCT o.id) > 0 AND COUNT(DISTINCT st.id) > 0 THEN 'Customer & Student'
         WHEN COUNT(DISTINCT o.id) > 0 THEN 'Customer Only'
         WHEN COUNT(DISTINCT st.id) > 0 THEN 'Student Only'
         ELSE 'No Activity'
       END as user_type
FROM users u
LEFT JOIN orders o ON u.id = o.user_id
LEFT JOIN students st ON u.id = st.user_id
GROUP BY u.id, u.first_name, u.last_name, u.email
ORDER BY orders_placed DESC, courses_enrolled DESC;
🎯 Our Learning Strategy:
- Start with Level 1-2 in TablePlus to get comfortable
- Progress through each level – try to understand each query before moving on
- Modify the queries – change filters, add fields, etc.
- Create your own variations based on business questions
to be continued … 🚀

